FB-TW

Thursday, May 31, 2012

More statin shenanigans


mouth full of pills

If you read the papers or watch the news you’ve probably heard about the recently published JUPITER study, advertised with bold headlines such as “Cholesterol drug causes risk of heart attack to plummet” and “Cholesterol-fighting drug shows wider benefit”. If you’ve been following this blog (and perhaps even if you haven’t), you are by now aware that such claims cannot be taken at face value.

You might suspect, for example, that the study was sponsored by a drug company and authored by researchers with financial interests tied to those drug companies. You might wonder if these associations could possibly – just possibly – influence not only the results of the study, but how those results are reported. You might also find yourself questioning the objectivity of a study with the title “Justification for the Use of Statins in Prevention: an Intervention Trial Evaluating Rosuvastatin” (JUPITER).

If you’re asking yourself these questions, you are definitely on the right track. The study was indeed sponsored by a drug company, AstraZeneca. And each author of this study received money in the form of grants, consulting fees and honoraria from pharmaceutical companies – in some cases up to twelve different companies, including AstraZeneca, the study sponsor. Take a look at this list detailing the financial interests of the study authors (now required by the New England Journal of Medicine and other prominent publications):

Dr. Ridker reports receiving grant support from AstraZeneca, Novartis, Merck, Abbott, Roche, and Sanofi-Aventis; consulting fees or lecture fees or both from AstraZeneca, Novartis, Merck, Merck–Schering-Plough, Sanofi-Aventis, Isis, Dade Behring, and Vascular Biogenics; and is listed as a coinventor on patents held by Brigham and Women’s Hospital that relate to the use of inflammatory biomarkers in cardiovascular disease, including the use of high-sensitivity C-reactive protein in the evaluation of patients’ risk of cardiovascular disease. These patents have been licensed to Dade Behring and AstraZeneca. Dr. Fonseca reports receiving research grants, lecture fees, and consulting fees from AstraZeneca, Pfizer, Schering-Plough, Sanofi-Aventis, and Merck; and Dr. Genest, lecture fees from AstraZeneca, Schering-Plough, Merck–Schering-Plough, Pfizer, Novartis, and Sanofi-Aventis and consulting fees from AstraZeneca, Merck, Merck Frosst, Schering-Plough, Pfizer, Novartis, Resverlogix, and Sanofi-Aventis. Dr. Gotto reports receiving consulting fees from Dupont, Novartis, Aegerion, Arisaph, Kowa, Merck, Merck–Schering-Plough, Pfizer, Genentech, Martek, and Reliant; serving as an expert witness; and receiving publication royalties. Dr. Kastelein reports receiving grant support from AstraZeneca, Pfizer, Roche, Novartis, Merck, Merck–Schering-Plough, Isis, Genzyme, and Sanofi-Aventis; lecture fees from AstraZeneca, GlaxoSmithKline, Pfizer, Novartis, Merck–Schering-Plough, Roche, Isis, and Boehringer Ingelheim; and consulting fees from AstraZeneca, Abbott, Pfizer, Isis, Genzyme, Roche, Novartis, Merck, Merck–Schering-Plough, and Sanofi-Aventis. Dr. Koenig reports receiving grant support from AstraZeneca, Roche, Anthera, Dade Behring and GlaxoSmithKline; lecture fees from AstraZeneca, Pfizer, Novartis, GlaxoSmithKline, DiaDexus, Roche, and Boehringer Ingelheim; and consulting fees from GlaxoSmithKline, Medlogix, Anthera, and Roche. Dr. Libby reports receiving lecture fees from Pfizer and lecture or consulting fees from AstraZeneca, Bristol-Myers Squibb, GlaxoSmithKline, Merck, Pfizer, Sanofi-Aventis, VIA Pharmaceuticals, Interleukin Genetics, Kowa Research Institute, Novartis, and Merck–Schering-Plough. Dr. Lorenzatti reports receiving grant support, lecture fees, and consulting fees from AstraZeneca, Takeda, and Novartis; Dr. Nordestgaard, lecture fees from AstraZeneca, Sanofi-Aventis, Pfizer, Boehringer Ingelheim, and Merck and consulting fees from AstraZeneca and BG Medicine; Dr. Shepherd, lecture fees from AstraZeneca, Pfizer, and Merck and consulting fees from AstraZeneca, Merck, Roche, GlaxoSmithKline, Pfizer, Nicox, and Oxford Biosciences; and Dr. Glynn, grant support from AstraZeneca and Bristol-Myers Squibb. No other potential conflict of interest relevant to this article was reported.
 
Now, the fact that these researchers receive money from all of these drug companies doesn’t mean that they are dishonest or that their data are invalid. However, if you think these conflicts of interest do not influence the outcomes of clinical research, then I suggest you read an article I published a few months ago called When It Comes To Drug Claims, Skepticism Is Healthy.

Now that you’ve put on your “Healthy Skeptic” goggles, we can move on and more closely examine the study itself. There are several things you need to be aware of as we discuss it.

First, although the press articles claim that the study looked at statin use in healthy populations, the subjects were people who had normal cholesterol but high CRP levels. CRP, or C-Reactive Protein, is a measure of inflammation in the body. It is now widely accepted even in the mainstream medical community that inflammation is a major risk factor for heart disease. And because inflammation is a sign of an underlying disease process, these patients were not, in fact, “healthy” as claimed.

There is little doubt that statins reduce inflammation, which can help prevent atherosclerosis. It appears that the benefits of statins are mainly due to this characteristic, rather than to their cholesterol-lowering effects. So it’s no surprise that the statins reduced rates of heart disease and mortality in this population that had inflammation going into the study.

I should also mention, however, that the predictive value of CRP for heart disease is highly controversial. Though some studies show a correlation between high CRP levels and heart disease, many others do not. Many physicians feel that CRP is not a useful indicator in clinical practice.

The second thing you need to be aware of is the difference between relative and absolute risk reduction. Relative risk reduction (RRR) measures how much the risk is reduced in the experimental group compared to a control group. Absolute risk reduction (ARR) is just the absolute difference in outcome rates between the control and treatment groups.

To make this more clear, let’s consider an example. Say that 2000 people enter a study for a particular drug and 1000 of them are randomized to placebo. At the end of the study, one person in the drug group died versus two people in the placebo group. The relative risk reduction of the drug group would thus be 50% (0.002 – 0.001/0.002). That sounds really impressive! The headline for this study might read “New drug reduces chance of dying by 50%!”. While technically true, you can see how misleading this can be. Why? Because when most people read that headline, they will interpret it to mean that if they take that drug, their risk of dying will be reduced by 50%, which is not even close to being true.

The absolute risk reduction, on the other hand, is always a much more modest number. Using the same example above, the absolute risk reduction in the drug group would have been a paltry one-tenth of a percent, or 0.1% (0.002 – 0.001). That’s not a very catchy headline, is it? “New drug reduces risk of dying by one-tenth of a percent”. It just doesn’t grab you the same way. But this is actually a more realistic view of what happened in the study and what we could expect to happen in the real world.

In fact, one could just as accurately say that in this hypothetical study, a patient has a 1-in-1000 (0.1%) chance of their life being saved by the drug. Said another way, 1,000 patients would have to be treated with this drug in order to save a single life. This measurement is called the Needed Number to Treat, and is another means for interpreting the results of clinical trials.

With that in mind, let’s examine the data from the JUPITER study. The actual numbers were 198 deaths out of 8901 in the statin group and 247 deaths out of 8901 in the placebo group. The relative risk reduction for total mortality (deaths) in the drug group was 19.8% [(247/8901 - 198/8901) / (247/8901)]. That means that the risk of death for people taking Crestor was 19.8% smaller than those taking placebo.

But what happens when we look at the absolute risk reduction numbers? According to the data, 2.77% (0.02774) of people taking the placebo died after two years versus 2.24% (0.02224) of people taking Crestor. This amounts to a difference of 0.55%, or one-half of one percent.

Here’s a graphical illustration of the difference in mortality between the Crestor and placebo group:
jupiter graph
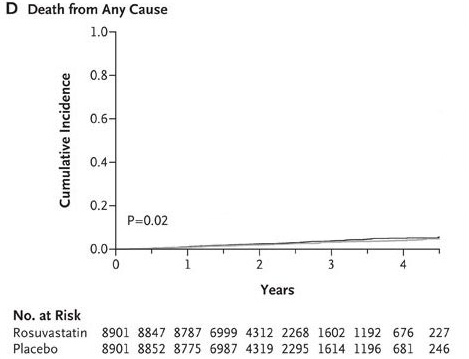
If you’re having trouble making much of a difference, I don’t blame you!

To make this even more clear, let’s use the Needed Number to Treat method of evaluating these results. According to the study data, 182 people would have to be treated with Crestor for two years in order to save a single life.

Now that may not sound like a large number to you, especially if yours was one of the lives saved. However, when evaluating the viability of any potential treatment three considerations (above and beyond the efficacy of the treatment) must be taken into account: cost, side effects, and alternatives.

Let’s look at cost first. The cost of one patient taking Crestor for one year is approximately $1,300. Therefore, to prevent 49 deaths 8,901 people would have to take Crestor for two years at a cost of $23 million dollars. That is an enormously expensive treatment by any measure.

Second, this particular study did not register significant side effects in the statin group. This is very fishy, though, since nearly every other study on statins to date has shown significant side effects and the approval of Crestor itself was delayed by the FDA due to concern about Crestor side effects.

While all statins are associated with rare instances of rhabdomyolysis, a breakdown of muscle cells, Crestor had shown in studies before its approval that the potentially deadly disease had surfaced in seven people. Crestor’s potential muscle- and liver-damaging side effects become more worrisome and difficult to justify in patients who are essentially healthy.

What’s more, the study only lasted two years. That’s not long enough to adequately establish safety for the drug, especially if people are going to use it “preventatively”, which means they could be taking it for several years and even decades. Statins have caused cancer in every single animal study to date. Since cancer can take up to 25 years to develop after initial exposure to the carcinogen, we simply cannot know at this point that statins won’t also significantly increase the risk of cancer in adults.

Finally, before jumping on the statin bandwagon and recommending that we spend billions of dollars treating healthy people with Crestor, we should consider if there isn’t a less costly and risky way of preventing deaths due to inflammation and heart disease.

Wouldn’t you know it, there sure is!

For the last decade medical research has increasingly demonstrated that heart disease is caused not by high cholesterol levels, but by inflammation and oxidative damage. A full explanation of these mechanisms is beyond the scope of this post, but for more details you can read two previous articles: Cholesterol Doesn’t Cause Heart Disease and How To Increase Your Risk of Heart Disease.

So, if we want to prevent and even treat heart disease, we need to address the causes of inflammation and oxidative damage. Again, there’s not room to go into great detail on this here but in general the primary causes of inflammation and oxidative damage are 1) a diet high in polyunsaturated oil (PUFA) and refined flour and sugar, 2) lack of physical activity, 3) stress and 4) smoking.

We can thus prevent heart disease by avoiding PUFA and refined/processed food, getting adequate exercise, reducing stress and not smoking. These simple dietary and lifestyle changes are likely to produce even better results than a statin, for a fraction of the cost and without any side effects. In fact, the only side effects of this approach are improved physiological and psychological health! For more specific recommendations, read my article Preventing Heart Disease Without Drugs.

Taking a statin to “prevent” inflammation and heart disease is rather like bailing water with a pail to prevent a boat from sinking instead of simply plugging the leak. Unfortunately, our entire health care system is oriented around “bailing water with a pail”, which is to say treating the symptoms of disease, instead of “plugging the leak”, or addressing the causes of disease before it develops. The reason this is the case is because there’s a lot more money to be made from drugs, surgery and other costly interventions than there is from encouraging people to eat well, exercise and reduce stress.

Even if we ignore all of the issues I’ve pointed out above, the best thing we can say about this study is that a small group of unusual patients – those with low LDL-cholesterol AND high C-reactive protein – may slightly decrease their risk for all-cause mortality by taking a drug that costs them almost $1,300 per year and slightly increases their risk for developing diabetes.

That’s the best spin possible given the data from this study. Compare that to the mainstream media headlines, and you’ll have a clear understanding of how financial conflicts of interest are seriously damaging the integrity and value of clinical research.

At least the media wasn’t completely fooled. They did manage to at least include the perspective of sane doctors who questioned the desirability of millions of relatively healthy people taking drugs for the rest of their lives. According to the Wall Street Journal:
Moreover, despite large relative benefits, the actual number of patients helped was small. Those on the drug suffered 142 major cardiovascular events compared with 251 on placebo, a difference of 109. Dr. Hlatky said that raises questions about the cost-effectiveness of CRP screening and the value of putting millions of low-risk patients on medication for the rest of their lives.
From the New York Times:
Some consumer advocates and doctors raised concerns about the expense of putting relatively healthy patients on statins, which would cost the health system billions of dollars.
From Fox News:

About 120 people would have to take Crestor for two years to prevent a single heart attack, stroke or death, said Stanford University cardiologist Dr. Mark Hlatky. He wrote an editorial accompanying the study published online by the New England Journal of Medicine.

“Everybody likes the idea of prevention. We need to slow down and ask how many people are we going to be treating with drugs for the rest of their lives to prevent heart disease, versus a lot of other things we’re not doing” to improve health, Hlatky said.
If you know of someone who is considering a statin after reading about the JUPITER study, please do them a favor and send them a link to this article first. They should hear both sides of the story before making such a significant decision.
==============================================================
Read the full article here.

Wednesday, May 23, 2012

The straight dope on cholesterol Part V - Attia

The straight dope on cholesterol – Part V

Concept #7 – Does the size of an LDL particle matter?

There are few, if any, topics in lipidology that generate more confusion and argument that this one. I’ve been leading up to it all month, so I think the time is here to address this issue head on. I’ve read many papers and seen many lectures on this topic, but the one that stole my heart was a lecture given by Jim Otvos at the ADA 66th Scientific Sessions in Washington, DC. Some of the figures I am using in this post are taken directly or modified from his talk or subsequent discussions.

At the outset of this discussion I want to point out two clinical scenarios to keep in mind:
  1. The most lethal lipoprotein disorder is familial hypercholesterolemia, which I have discussed in previous posts. Such patients all have large LDL particles, but most of these patients die in childhood or early adulthood if not treated with medications to reduce particle number.
  2. Conversely, diabetic patients and other patients with advanced metabolic syndrome have small LDL particles, yet often live well into their 50s and 60s before succumbing to atherosclerotic diseases.
The common denominator is that both sets of patients in (1) and (2) have high LDL-P. What I’m going to attempt to show you today is that once adjusted for particle number, particle size has no statistically significant relationship to cardiovascular risk. But first, some geometry.

“Pattern A” versus “Pattern B” LDL

The introduction of gradient gel electrophoresis about 30 years ago is what really got people interested in the size of LDL particles. There is no shortage of studies of the past 25 years demonstrating that of the following 2 scenarios, one has higher risk, all other things equal. [This is a big disclaimer and I went back and forth for a while before deciding to include this point. It is an uncharacteristic oversimplification. If you’ve been reading this blog for a while, you’ll know I’m rarely accused of that sin – but I’m about to be].

Here’s the example: Consider 2 patients, both with the same total content of cholesterol in their LDL particles, say, 130 mg/dL. Furthermore, assume each has the “ideal” ratio of core cholesterol ester-to-triglyceride (recall from Part I and III of this series, this ratio is 4:1). I’m going to explain in a subsequent post why this assumption is probably wrong as often as it’s right, but for the purpose of simplicity I want to make a geometric point.
  1. LDL-C = 130 mg/dL, Pattern A (large particles) – person on the left in the figure below
  2. LDL-C = 130 mg/dL, Pattern B (small particles) – person on the right in the figure below
Under the set of assumptions I’ve laid out, case #2 is the higher risk case. In other words, at the same concentration of cholesterol within LDL particles, assuming the same ratio of CE:TG, it is mathematically necessary the person on the right, case #2, has more particles, and therefore has greater risk.
Bonus concept: What one really must know is how many cholesterol molecules there are per LDL particle. It always requires more cholesterol-depleted LDL particles than cholesterol-rich LDL particles to traffic cholesterol in plasma, and the number of cholesterol molecules depends on both size and core TG content. The more TG in the particle, the less the cholesterol in the particle.
So why does the person on the right have greater risk? Is it because they have more particles? Or is it because they have smaller particles?

This is the jugular question I want to address today.

Small vs. large particles

If you understand that the person on the right, under the very careful and admittedly overly simplified assumptions I’ve given, is at higher risk than the person on the left, there are only 4 possible reasons:
  1. Small LDL particles are more atherogenic than large ones, independent of number.
  2. The number of particles is what increases atherogenic risk, independent of size.
  3. Both size and number matter, and so the person on the right is “doubly” at risk.
  4. Neither feature matters and these attributes (i.e., size and number) are markers for something else that does matter.
Anyone who knows me well knows I love to think in MECE terms whenever possible. This is a good place to do so.

I’m going to rule out Reason #4 right now because if I have not yet convinced you that LDL particles are the causative agent for atherosclerosis, nothing else I say matters. The trial data are unimpeachable and there are now 7 guidelines around the world advocating particle number measurement for risk assessment. The more LDL particles you have, the greater your risk of atherosclerosis.

But how do we know if Reason #1, #2, or #3 is correct?

This figure (one of the most famous in this debate) is from the Quebec Cardiovascular Study, published in 1997, in Circulation. You can find this study here.

Relative risks

This is kind of a complex graph if you’re not used to looking at these. It shows relative risk – but in 2 dimensions. It’s looking at the role of LDL size and apoB (a proxy for LDL-P, you’ll recall from previous posts). What seems clear is that in patients with low LDL-P (i.e., apoB < 120 mg/dl), size does not matter. The relative risk is 1.0 in both cases, regardless of peak LDL size. However, in patients with lots of LDL particles (i.e., apoB > 120 mg/dl), smaller peak LDL size seems to carry a much greater risk – 6.2X.

If you just looked at this figure, you might end up drawing the conclusion that both size and number are independently predictive of risk (i.e., Reason #3, above). Not an illogical conclusion…
What is not often mentioned, however, is what is in the text of the article:
“Among lipid, lipoprotein,and apolipoprotein variables, apo B [LDL-P] came out as the best and only significant predictor of ischemic heart disease (IHD) risk in multivariate stepwiselogistic analyses (P=.002).”
“LDL-PPD [peak LDL particle diameter] — as a continuous variable did not contribute to the risk of IHD after the contribution of apo B levels to IHD risk had been considered.”
What’s a continuous variable? Something like height or weight, where the possible values are infinite between a range. Contrast this with discrete variables like “tall” or “short,” where there are only two categories. For example, if I define “tall” as greater than 6 feet, the entire population of the world could be placed in two buckets: Those who are “short” (i.e., less than 6 feet tall) and those who are “tall” (i.e., those who are 6 feet tall and taller). This figure shows LDL size like it’s a discrete variable – “large” or “small” – but obviously it is not. It’s continuous, meaning it can take on any value, not just “large” or “small.” When this same analysis is done using LDL size as the continuous variable it is, the influence of size goes away and only apoB (i.e., LDL-P) matters.

This effect has been observed subsequently, including the famous Multi-Ethnic Study of Atherosclerosis (MESA) trial, which you can read here. The MESA trial looked at the association between LDL-P, LDL-C, LDL size, IMT (intima-media thickness – the best non-invasive marker we have for atherosclerosis), and many other parameters in about 5,500 men and women over a several year period.

This study used the same sort of statistical analysis as the study above to parse out the real role of LDL-P versus particle size, as summarized in the table below.

unadjusted-vs.-adjusted-table

This table shows us that when LDL-P is NOT taken into account (i.e., “unadjusted” analysis), an increase of one standard deviation in particle size is associated with 20.9 microns of LESS atherosclerosis, what one might expect if one believes particle size matters. Bigger particles, less atherosclerosis.

However, and this is the important part, when the authors adjusted for the number of LDL particles (in yellow), the same phenomenon was not observed. Now an increase in LDL particle size by 1 standard deviation was associated with an ADDITIONAL 14.5 microns of atherosclerosis, albeit of barely any significance (p=0.05).

Let me repeat this point: Once you account for LDL-P, the relationship of atherosclerosis to particle size is abolished (and even trends towards moving in the “wrong” direction – i.e., bigger particles, more atherosclerosis).

Let me use another analysis to illustrate this point again. If you adjust for age and sex, but not LDL-P [left graph, below], changes in the number of LDL particles (shown in quintiles, so each group shows changes by 20% fractions) seem to have no relationship with IMT (i.e., atherosclerosis).
However, when you adjust for small LDL-P [right graph, below], it becomes clear that increased numbers of large LDL particles significantly increase risk.

Adjustment-for-large-LDL
I’ve only covered a small amount of the work addressing this question, but this issue is now quite clear. A small LDL particle is no more atherogenic than a large one, but only by removing confounding factors is this clear. So, if you look back at the figure I used to address this question, it should now be clear that Reason #2 is the correct one.

This does not imply that the “average” person walking around with small particles is not at risk. It only implies the following:
  1. The small size of their particles is probably a marker for something else (e.g., metabolic derangement due to higher trafficking of triglycerides within LDL particles);
  2. Unless you know their particle number (i.e., LDL-P or apoB), you actually don’t know their risk.
Let’s wrap it up here for this week. Next week we’ll address another question that’s probably been on your mind: Why do we need to measure LDL-P or apoB? Isn’t the LDL-C test my doctor orders enough to predict my risk?

Summary

  • At first glance it would seem that patients with smaller LDL particles are at greater risk for atherosclerosis than patients with large LDL particles, all things equal. Hence, this idea that Pattern A is “good” and Pattern “B” is bad has become quite popular.
  • To address this question, however, one must look at changes in cardiovascular events or direct markers of atherosclerosis (e.g., IMT) while holding LDL-P constant and then again holding LDL size constant. Only when you do this can you see that the relationship between size and event vanishes. The only thing that matters is the number of LDL particles – large, small, or mixed.
  • “A particle is a particle is a particle.” If you don’t know the number, you don’t know the risk.
====================================================================
Read Peter Attia's complete article here.

Friday, May 18, 2012

Statins for healthy people? Hang on a minute…

Statins for healthy people? Hang on a minute…

I’ve had a few emails today alerting me to reports of a study concerning the use of statins in healthy individuals. The study in question is a meta-analysis (grouping together of similar studies) of statin trials [1]. Part of this meta-analysis involved assessing the impact of statin therapy in individuals deemed to be at relatively low risk of cardiovascular events such as heart attacks and strokes. One of the stand-out findings of this study is that statins led to a statistically significant reduction in risk of ‘major vascular events’. This was even true for individuals at less than 10 per cent risk of vascular events over a 5-year period. This has led to the suggestion that statins used might be widened to even people at low risk of cardiovascular problems.

Before we swallow this idea, though, it is perhaps a good idea to see just how effective statins were found to be in this meta-analsysis. First of all, what is meant by ‘major vascular events’? Actually, this is a term that includes many different potential outcomes including fatal and non-fatal heart attacks and strokes and ‘revascularisation’ procedures (such as placing tubes called stents in the coronary arteries). When a lot of different outcomes are grouped together, it makes it much more likely that a ‘statistically significant’ results will emerge.

When the outcomes are narrowed a little, the results are less impressive. For example, when we look at risk of death from any vascular event (a heart attack or stroke), we find that statins did not reduce risk in individuals deemed to be at low risk (<10 per cent over 5 years). This, by the way, was even true for those who had known vascular disease.

The ‘positive’ findings from this study have, as is often the case, been expressed as reductions in relative risk. The risk of vascular events overall was 21 per cent lower for each 1 mmol/l (39 mg/ml) reduction in levels of low density lipoprotein cholesterol (LDL-C). However, when overall risk is low, then a relative risk reduction might not amount to much in real terms.

We’re told by the authors this meta-analysis that treating with statins prevented 11 major vascular events for every 1000 people treated for a period of 5 years. Put another way, 91 people would need to be treated for 5 years to prevent one major vascular event. Or in other words, only about 1 per cent of people treated with statins for 5 years will benefit (and about 99 per cent won’t).

Overall, lowering LDL-C by 1 mmol/l was found to reduce the risk of death by 9 per cent over a 5-year period. Again, this might sound like a positive finding to some, but the actual reduction in risk of death was 0.2 per cent per year. What this means is that at this level of cholesterol reduction, 500 individuals would need to be treated with statins for a year for one person to have his/her life saved.
The authors of this meta-analysis give us some soothing reassurances about the fact that the benefits of statins vastly outweighing the risks of adverse events such as myopapthy (muscle pain and weakness). They quote of the excess incidence of myopathy as 0.5 cases per 1000 people over 5 years. However, the source they quote is based on diagnosing myopathy once the marker for muscle damage (creatine kinase) is at least TEN TIMES the upper limit of normal. Many individuals will have significant pain and weakness with much lower levels of creatine kinase. Statins are also linked with adverse effects on the liver and kidneys, and increase risk of diabetes too.

Despite the very positive interpretation of the data by the study authors and the media, this meta-analysis shows us again what previous evidence has revealed: statins are highly ineffective in terms of improving health and saving lives. And their risks are generally downplayed.

Collectively, the authors of the meta-analysis are referred to as the Cholesterol Treatment Trialists’ (CTT) Collaborators, including researchers from Clinical Trial Service Unit and Epidemiological Studies Unit at Oxford University. The conflicts of interest statement which accompanies this paper informs us that: “Some members of the writing committee have received reimbursement of costs to participate in scientific meetings from the pharmaceutical industry.” I suppose this may account, at least in part, for a data interpretation that appears so heavily biased towards statins.

References:
Cholesterol Treatment Trialists’ (CTT) Collaborators. The effects of lowering LDL cholesterol with statin therapy in people at low risk of vascular disease: meta
-analysis of individual data from 27 randomised trials. The Lancet epub 17th May 2012
============================================================================
Read the full atricle here.http://www.drbriffa.com/2012/05/18/statins-for-healthy-people-hang-on-a-minute/

Wheat: opiate of the masses?


Last week I was aboard a cruise liner in the Caribbean. I had a lot of fun but was primarily there to participate in a kinda conference organised by low-carb advocate Jimmy Moore. I was privileged to share the stage with some very lovely and inspiration speakers, among them the US cardiologist Dr William (Bill) Davis. I was looking forward to meeting Bill because I’d had a skype conversation with him some months ago, and was impressed by his warmth, humour and humanity. In person, Bill did not disappoint, and he also gave what I thought was a fascinating presentation about the perils of one of the modern-day diet’s most ubiquitous components – wheat.

Bill is the author of the highly acclaimed and readable book Wheat Belly, which systemically makes a strong case for the elimination of this grain from our diets. His lecture on the low-carb cruise’ focused on this aspect of his work, and focused on what I took to be three key areas:

1. wheat’s content of the readily-digested starch amylopectin A, which is highly disruptive to blood sugar levels.

2. The lectin (toxin) in wheat known as ‘wheat germ agglutinin’ which can cause inflammation in the gut and elsewhere.

3. Gliadin – a component of gluten in wheat which has, among other things, drug-like effects.

It’s this last issue I’m going to focus on in this blog post.

In his lecture, Bill drew our attention to the fact that gliadin may not be fully digested in the gut, and give rise to small protein molecules known as ‘polypeptides’. These can sometimes penetrate the gut to gain access to the bloodstream, after which they also have capacity to make their way across the ‘blood-brain-barrier’. Once there, gliadin polypeptides can bind to opiate receptors in the brain. Opiates include chemicals like morphine, heroin and opium.

The body can generate chemicals which bind to opiate receptors which are termed ‘endorphins’. However, when a substance comes from outside the body, it is termed an ‘exorphin’. Gluten-derived exorphins can induce a feeling of mild euphoria. This might explain why tucking into bread, or a bowl of pasta, or some biscuits can seemingly be so intensely pleasurable for some. It might also explain why some struggle with leaving wheat alone.

One of the main reasons Bill highlighted the opiate effects of gluten is because it appears, to all intents and purposes, to be an appetite stimulate. Of course you’d expect anything that is somewhat addictive to drive us to consume more of it. And as Bill pointed out, there does seem to be some scientific evidence for this.

To understand the nature of this research, we need to understand the effects of the drug naloxone. This drug binds to opiate receptors, knocking off anything else that may be bound there. As a result, naloxone reverses the effects of opiate drugs like heroin and morphine, and quickly too.
So, what happens when normal wheat-consuming people are treated with naloxone? In one study, individuals were given access to a free food and their intakes measured over two meals approximately 5 hours apart [1]. On another occasion the experiment was repeated after naloxone had been administered to the study subjects. On this occasion, they consumed about 400 calories less.

In another study, ‘binge-eaters’ were given access to a free buffet with and without nalaoxone [2]. With naloxone on board, individuals ate 28 per cent less in the way of wheat-based foods such as crackers, pretzels and bread sticks.

My experience in practice tells me that the ability of wheat (and other gluten-containing foods such as barley and rye) to have addictive qualities varies quite a lot between individuals. It does seem to be a real phenomenon, though, and there’s no doubt in my mind that eliminating or dramatically reducing wheat consumption usually leads to a significant improvement in wellbeing, energy levels, mental function (and usually weight loss) in the majority of people.

Starchy foods, especially ‘healthy wholegrains’ are often vigorously promoted to those looking to eat a nutritious diet. Wheat has a reputation as the staff of life. In reality, though, it’s often the stuff of nightmares.

References:
1. Cohen MR, et al. Naloxone reduces food intake in humans. Psychosom Med. 1985;47(2):132-8.
2. Drewnowski A, et al. Naloxone, an opiate blocker, reduces the consumption of sweet high-fat foods in obese and lean female binge eaters. Am J Clin Nutr. 1995;61(6):1206-12.
=========================================================================================================
Read the full article here.

Thursday, May 17, 2012

The straight dope on cholesterol Part IV - Attia


Coronary artery
Previously, in Part I, Part II and Part III of this series, we addressed these 5 concepts:
#1What is cholesterol?
#2What is the relationship between the cholesterol we eat and the cholesterol in our body?
#3Is cholesterol bad?
#4 How does cholesterol move around our body?
#5 How do we measure cholesterol?
In this post we’ll continue to build out the story with the next concept:
#6How does cholesterol actually cause problems?
Asked another way, how does someone end up with a coronary artery that looks like the one in the picture above?

Quick refresher on take-away points from previous posts, should you need it:

  1. Cholesterol is “just” another fancy organic molecule in our body but with an interesting distinction: we eat it, we make it, we store it, and we excrete it – all in different amounts.
  2. The pool of cholesterol in our body is essential for life. No cholesterol = no life.
  3. Cholesterol exists in 2 formsunesterified or “free” (UC) and esterified (CE) – and the form determines if we can absorb it or not, or store it or not (among other things).
  4. Much of the cholesterol we eat is in the form of CE. It is not absorbed and is excreted by our gut (i.e., leaves our body in stool). The reason this occurs is that CE not only has to be de-esterified, but it competes for absorption with the vastly larger amounts of UC supplied by the biliary route.
  5. Re-absorption of the cholesterol we synthesize in our body (i.e., endogenous produced cholesterol) is the dominant source of the cholesterol in our body. That is, most of the cholesterol in our body was made by our body.
  6. The process of regulating cholesterol is very complex and multifaceted with multiple layers of control. I’ve only touched on the absorption side, but the synthesis side is also complex and highly regulated. You will discover that synthesis and absorption are very interrelated.
  7. Eating cholesterol has very little impact on the cholesterol levels in your body. This is a fact, not my opinion. Anyone who tells you different is, at best, ignorant of this topic. At worst, they are a deliberate charlatan. Years ago the Canadian Guidelines removed the limitation of dietary cholesterol. The rest of the world, especially the United States, needs to catch up. To see an important reference on this topic, please look here.
  8. Cholesterol and triglycerides are not soluble in plasma (i.e., they can’t dissolve in water) and are therefore said to be hydrophobic.
  9. To be carried anywhere in our body, say from your liver to your coronary artery, they need to be carried by a special protein-wrapped transport vessel called a lipoprotein.
  10. As these “ships” called lipoproteins leave the liver they undergo a process of maturation where they shed much of their triglyceride “cargo” in the form of free fatty acid, and doing so makes them smaller and richer in cholesterol.
  11. Special proteins, apoproteins, play an important role in moving lipoproteins around the body and facilitating their interactions with other cells. The most important of these are the apoB class, residing on VLDL, IDL, and LDL particles, and the apoA-I class, residing for the most part on the HDL particles.
  12. Cholesterol transport in plasma occurs in both directions, from the liver and small intestine towards the periphery and back to the liver and small intestine (the “gut”).
  13. The major function of the apoB-containing particles is to traffic energy (triglycerides) to muscles and phospholipids to all cells. Their cholesterol is trafficked back to the liver. The apoA-I containing particles traffic cholesterol to steroidogenic tissues, adipocytes (a storage organ for cholesterol ester) and ultimately back to the liver, gut, or steroidogenic tissue.
  14. All lipoproteins are part of the human lipid transportation system and work harmoniously together to efficiently traffic lipids. As you are probably starting to appreciate, the trafficking pattern is highly complex and the lipoproteins constantly exchange their core and surface lipids.
  15. The measurement of cholesterol has undergone a dramatic evolution over the past 70 years with technology at the heart of the advance.
  16. Currently, most people in the United States (and the world for that matter) undergo a “standard” lipid panel which only directly measures TC, TG, and HDL-C. LDL-C is measured or most often estimated.
  17. More advanced cholesterol measuring tests do exist to directly measure LDL-C (though none are standardized), along with the cholesterol content of other lipoproteins (e.g., VLDL, IDL) or lipoprotein subparticles.
  18. The most frequently used and guideline-recommended test that can count the number of LDL particles is either apolipoprotein B or LDL-P NMR which is part of the NMR LipoProfile. NMR can also measure the size of LDL and other lipoprotein particles, which is valuable for predicting insulin resistance in drug naïve patients (i.e., those patients not on cholesterol-lowering drugs), before changes are noted in glucose or insulin levels.

Concept #6 How does cholesterol actually cause problems?

If you remember only one factoid from the previous three posts on this topic, remember this: If you were only “allowed” to know one metric to understand your risk of heart disease it would be the number of apoB particles (90-95% of which are LDLs) in your plasma. In practicality, there are two ways to do this:
  1. Directly measure (i.e., not estimate) the concentration of apoB in your plasma (several technologies and companies offer such an assay). Recall, there is one apoB molecule per particle;
  2. Directly measure the number of LDL particles in your plasma using NMR technology.
If this number is high, you are at risk of atherosclerosis. Everything else is secondary.
Does having lots of HDL particles help? Probably, especially if they are “functional” at carrying out reverse cholesterol transport, but it’s not clear if it matters when LDL particle count is low. In fact, while many drugs are known to increase the cholesterol content of HDL particles (i.e., HDL-C), not one to date has ever shown a benefit from doing so. Does having normal serum triglyceride levels matter? Probably, with “normal” being defined as < 70-100 mg/dL, though it’s not entirely clear this is an independent predictor of low risk. Does having a low level of LDL-C matter? Not if LDL-P (or apoB) are high, or better said, not when the two markers are discordant.

But why?
As with the previous topics in this series, this question is sufficiently complex to justify several textbooks – and it’s still not completely understood. My challenge, of course, is to convey the most important points in a fraction of that space and complexity.

Let’s focus, specifically, on the unfortunately-ubiquitous clinical condition of atherosclerosis – the accumulation of sterols and inflammatory cells within an artery wall which may (or may not) narrow the lumen of the artery.
Bonus concept: It’s important to keep in mind that this disease process is actually within the artery wall and it may or may not affect the arterial lumen, which is why angiograms can be normal in persons with advanced atherosclerosis. As plaque progresses it can encroach into the lumen leading to ischemia (i.e., lack of oxygen delivery to tissues) as the narrowing approaches 70-75%, or the plaque can rupture leading to a thrombosis: partial leading to ischemia or total leading to infarction (i.e., tissue death).
To be clear, statistically speaking, this condition (atherosclerotic induced ischemia or infarction) is the most common one that will result in the loss of your life. For most of us, atherosclerosis (most commonly within coronary arteries, but also carotid or cerebral arteries) is the leading cause of death, even ahead of all forms of cancer combined. Hence, it’s worth really understanding this problem.

In this week’s post I am going to focus exclusively on what I like to call the “jugular issue” – that is, I’m going to discuss the actual mechanism of atherosclerosis. I’m not going to discuss treatment (yet). We can’t get into treatment until we really understand the cause.
“It is in vain to speak of cures, or think of remedies, until such time as we have considered of the causes . . . cures must be imperfect, lame, and to no purpose, wherein the causes have not first been searched.”
Robert Burton, The Anatomy of Melancholy, 1893
The sine qua non of atherosclerosis is the presence of sterols in arterial wall macrophages. Sterols are delivered to the arterial wall by the penetration of the endothelium by an apoB-containing lipoprotein, which transport the sterols. In other words, unless an apoB-containing lipoprotein particle violates the border created by an endothelium cell and the layer it protects, the media layer, there is no way atherogenesis occurs.

For now, let’s focus only on the most ubiquitous apoB-containing lipoprotein, the LDL particle. Yes, other lipoproteins also contain apoB (e.g., chylomicrons, remnant lipoproteins such as VLDL remnants, IDL and Lp(a)), but they are few in number relative to LDL particles. I will address them later.
The endothelium is the one-cell-thick-layer which lines the lumen (i.e., the “tube”) of a vessel, in this case, the artery. Since blood is in direct contact with this cell all the time, all lipoproteins – including LDL particles – come in constant contact with such cells.

So what drives an LDL particle to do something as sinister as to leave the waterway (i.e., the bloodstream) and “illegally” try to park at a dock (i.e., behind an endothelial cell)? Well, it is a gradient driven process which is why particle number is the key driving parameter.

As it turns out, this is probably a slightly less important question than the next one: what causes the LDL particle to stay there? In the parlance of our metaphor, not only do we want to know why the ship leaves the waterway to illegally park in the dock, but why does it stay parked there? This phenomenon is called “retention.”

Finally, if there was some way an LDL particle could violate the endothelium, AND be retained in the space behind the cell (away from the lumen on the side aptly called the sub-endothelial side) BUT not elicit an inflammatory (i.e., immune) response, would it matter?

I don’t know. But it seems that not long after an LDL particle gets into the sub-endothelial space and takes up “illegal” residence (i.e., binds to arterial wall proteoglycans), it is subject to oxidative forces and as one would expect an inflammatory response is initiated. The result is full blown mayhem. Immunologic gang warfare breaks out and cells called monocytes and macrophages and mast cells show up to investigate. When they arrive, and find the LDL particle, they do all they can to remove it. In some cases, when there are few LDL particles, the normal immune response is successful. But, it’s a numbers game. When LDL particle invasion becomes incessant, even if the immune cells can remove some of them, it becomes a losing proposition and the actual immune response to the initial problem becomes chronic and maladaptive and expands into the space between the endothelium and the media.

The multiple-sterol-laden macrophages or foam cells coalesce, recruit smooth muscle cells, induce microvascularization, and before you know it complex, inflamed plaque occurs. Microhemorrhages and microthrombus formations occur within the plaque. Ultimately the growing plaque invades the arterial lumen or ruptures into the lumen inducing luminal thrombosis. Direct luminal encroachment by plaque expansion or thrombus formation causes the lumen of the artery to narrow, which may or may not cause ischemia.

Before we go any further, take a look at the figure below from an excellent review article on this topic from the journal Circulation – Subendothelial Lipoprotein Retention as the Initiative Process in Atherosclerosis. This figure also discuss treatment strategies, but for now just focus on the pathogenesis (i.e., the cause of the problem).
In this figure you can see the progression:
  1. LDL particles (and a few other particles containing apoB) enter the sub-endothelium
  2. Some of these particles are retained, especially in areas where there is already a bit of extra space for them (called pre-lesion susceptible areas)
  3. “Early” immune cells initiate an inflammatory response which includes the direct interaction between the LDL particle and proteins called proteoglycans.
  4. The proteoglycans further shift the balance of LDL particle movement towards retention. Think of them as “cement” keeping the LDL particles and their cholesterol content in the sub-endothelial space.
  5. More and more apoB containing particles (i.e., LDL particles and the few other particles containing apoB) enter the sub-endothelial space and continue to be retained, due to the existing “room” being created by the immune response.
  6. As this process continues, an even more advanced form of immune response – mediated by cells called T-cells – leads to further retention and destruction of the artery wall.
  7. Eventually, not only does the lumen of the artery narrow, but a fibrous cap develops and plaques take form.
  8. It is most often these plaques that lead to myocardial infarction, or heart attacks, as they eventually dislodge and acutely obstruct blood flow to the portion of muscle supplied by the artery.
Early progression
Another way to see this progression is shown in the figure below, which shows the histologic progression of atherosclerosis in the right coronary artery from human autopsy specimens. This figure is actually a bit confusing until you understand what you’re looking at. Each set of 3 pictures shows the same sample, but with a different kind of histological stain. Each row represents a different specimen.
  • The column on the left uses a stain to highlight the distinction between the intimal and media layer of the artery call. The intima, recall, is the layer just below the endothelium and should not be as thick as shown here.
  • The middle column uses a special stain to highlight the presence of lipids within the intimal layer.
  • The right column uses yet a different stain to highlight the presence of macrophages in the intima and the media. Recall, macrophages are immune cells that play an important role of the inflammatory cascade leading to atherosclerosis.
Histology
What is particularly compelling about this sequence of figures is that you can see the trigger of events from what is called diffuse intimal thickening (“DIT”), which exacerbates the retention of lipoproteins and their lipid cargo, only then to be followed by the arrival of immune cells, which ultimately lead the inflammatory changes responsible for atherosclerosis.

Why LDL-P matters most

You may be asking the chicken and egg question:
Which is the cause – the apoB containing LDL particle OR the immune cells that “overreact” to them and their lipid cargo?

You certainly wouldn’t be alone in asking this question, as many folks have debated this exact question for years. The reason, of course, it is so important to ask this question is captured by the Robert Burton quote, above. If you don’t know the cause, how can you treat the disease?

Empirically, we know that the most successful pharmacologic interventions demonstrated to reduce coronary artery disease are those that reduce LDL-P and thus delivery of sterols to the artery. (Of course, they do other things also, like lower LDL-C, and maybe even reduce inflammation.)

Perhaps more compelling is the “natural experiment” of people with genetic alterations leading to elevated or reduced LDL-P. Let’s consider an example of each:
  1. Cohen, et al. reported in the New England Journal of Medicine in 2006 on the cases of patients with mutations in an enzyme called proprotein convertase subtilisin type 9 or PCSK9 (try saying that 10 times fast). Normally, this proteolytic enzyme degrades LDL receptors on the liver. Patients with mutations (“nonsense mutations” to be technically correct, meaning the enzyme is somewhat less active) have less destruction of hepatic LDL receptors. Hence, they have more sustained expression of hepatic LDL receptors, improved LDL clearance from plasma and therefore fewer LDL particles. These patients have very low LDL-P and LDL-C concentrations (5-40 mg/dL) and very low incidence of heart disease. Note that a reduction in PCSK9 activity plays no role in reducing inflammation.
  2. Conversely, patients with familial hypercholesterolemia (known as FH) have the opposite problem. While there are several variants and causes of this disease, the common theme is having decreased clearance of apoB-containing particles, often but not always due to defective or absent LDL receptors, leading to the opposite problem from above. Namely, these patients have a higher number of circulating LDL particles, and as a result a much higher incidence of atherosclerosis.
So why does having an LDL-P of 2,000 nmol/L (95th percentile) increase the risk of atherosclerosis relative to, say, 1,000 nmol/L (20th percentile)? In the end, it’s a probabilistic game. The more particles – NOT cholesterol molecules within the particles and not the size of the LDL particles – you have, the more likely the chance a LDL-P is going to ding an endothelial cell, squeeze into the sub-endothelial space and begin the process of atherosclerosis.

What about the other apoB containing lipoproteins?

Beyond the LDL particle, other apoB-containing lipoproteins also play a role in the development of atherosclerosis, especially in an increasingly insulin resistant population like ours. In fact, there is some evidence that particle-for-particle Lp(a) is actually even more atherogenic than LDL (though we have far fewer of them). You’ll recall that Lp(a) is simply an LDL particle to which another protein called apoprotein(a) is attached, which is both a prothrombotic protein as well as a carrier of oxidized lipids – neither of which you want in a plaque. The apo(a) also retards clearance of Lp(a) thus enhancing LDL-P levels. It may foster greater penetration of the endothelium and/or greater retention within the sub-endothelial space and/or elicit an even greater immune response.

In summary

  1. The progression from a completely normal artery to an atherosclerotic one which may or may not be “clogged” follows a very clear path: an apoB containing particle gets past the endothelial layer into the sub-endothelial space, the particle and its cholesterol content is retained and oxidized, immune cells arrive, an initially-beneficial inflammatory response occurs that ultimately becomes maladaptive leading to complex plaque.
  2. While inflammation plays a key role in this process, it’s the penetration of the apoB particle, with its sterol passengers, of the endothelium and retention within the sub-endothelial space that drive the process.
  3. The most numerous apoB containing lipoprotein in this process is certainly the LDL particle, however Lp(a) (if present) and other apoB containing lipoproteins may play a role.
  4. If you want to stop atherosclerosis, you must lower the LDL particle number. Period.
===================================================
Read the full article here.

Wednesday, May 9, 2012

How do we measure cholesterol?

How do we measure cholesterol?

Posted by on May 10, 2012


Concept #5 How do we measure cholesterol?

All this talk about cholesterol probably has some of you wondering how one actually measures the stuff. Much of the raw content I’m going to present here is actually material I’ve had to learn recently. One of the best resources I’ve found on this topic is the text book Contemporary Cardiology: Therapeutic Lipidology, in particular, chapter 14 by Tom Dayspring and chapter 15 by Bill Cromwell and Jim Otvos. Anyone aspiring to be a lipid savant like these three pioneers probably ought to get a copy. The other book that tells this story well is The Cholesterol Wars: The Skeptics versus the Preponderance of Evidence. For most folks, however, I’m hoping this series is sufficient and I’ll do my best to get the important points across.

As far back as the 1940’s scientists understood that cholesterol and lipids could not simply travel freely within the bloodstream without something to carry them and obscure their hydrophobicity, but it certainly wasn’t clear what these carriers looked like.

The initial breakthrough came during the Second World War when two researchers, E.J. Cohn and J.L. Oncley at Harvard developed a complex and elaborate technique to fractionate (i.e., separate) human serum (serum is blood, less the cells and clotting factors) into two “classes” of lipoproteins: those with alpha mobility and those with beta mobility. [“Alpha” versus “beta” mobility describes a pattern of movement seen by different particles, relative to fluid, under a uniform electric field, which is the essence of electrophoresis.]

You’ll recall that LDL particles are also called “beta” particles and HDL particles are also called “alpha” particles. Now you see why.

This work set the stage for subsequent work, by a physicist named John Gofman, using the techniques of preparative and analytic ultracentrifugation to fully classify the major classes of human lipoproteins. The table below summarizes what was gleaned by these experiments.

lipoprotein characteristics
Cool, huh? Well, sort of. While this was an enormous breakthrough scientifically, it didn’t really have an inexpensive and quick test that could be used clinically the way, say, one could measure glucose levels or hemoglobin levels in patients routinely. What became crucial with Gofman’s discovery is that lipoproteins were now a recognized entity and they got their names according to their buoyancy: very low density, intermediate density, low density and high density.

There is more interesting history to this tale, but let’s fast-forward to where we are today. When you go to your doctor to have your cholesterol levels checked, what do they actually do?

Let’s start at the finish line. What do they report? The figure below is a representative result. It reports serum cholesterol (in total), serum triglycerides, HDL cholesterol (i.e., HDL-C), LDL cholesterol (i.e., LDL-C) and sometimes non-HDL-C (i.e., LDL-C + VLDL-C). But where do these numbers come from?
cholesterol_test
Blood is drawn into a tube called a serum separator tube (SST) and immediately spun in centrifuge to separate the blood from “whole blood” into serum (normally clear yellow, top) and blood cells (dark red, bottom). A gel film, from the SST, separates the serum and blood cells, as shown below. The tube is kept cool and sent from the phlebotomy lab to the processing lab.
SS tube
As early as the 1950’s scientists figured out clever chemical tricks to directly measure the content of total cholesterol in the serum. The chemical details probably are not interesting to non-chemists, but I was able to find a great paper from 1961 that details the methodology. The point is this: initially it was only possible to measure the total content of cholesterol (TC), or concentration to be technically correct, in plasma. By that I mean it is the total mass (weight of all the cholesterol molecules) of cholesterol trafficked within all of the lipoprotein species that exist in a specified unit of volume: in the United States, we measure this in milligram of cholesterol per deciliter of plasma abbreviated as mg/dL, or in the rest of the world as mmol/Liter or mmol/L. Why? Think back to our analogy from last week:
Cholesterol is a passenger on a ship — the “ship,” of course, being a lipoprotein particle. The early methods of measuring cholesterol had to break apart the hull of the ship to quantify the cargo. The assays to do so, like the one described above, were pretty harsh. If you had a bunch of LDL ships, HDL ships, VLDL ships, and IDL ships, these assays ripped them all apart and told you the sum total of the cargo. Obviously this was a great breakthrough in the day, but it was limited. From this assay, one could conclude, for example, that a person had 200 mg/dL of cholesterol hiding out in all their lipoprotein particles.

Good to know, but what next? It turns out there were two other important factors that could be measured directly in blood: triglycerides and the cholesterol content within the HDL particle, HDL-C. Early on laboratories could easily separate apoA-I-containing particles (i.e., HDL) from the apoB-containing particles (i.e., VLDLs, IDLs and LDLs), but they could not easily and economically separate the various apoB-containing particles from one another. A full description of these methods is not necessary to appreciate this discussion, but for those interested, methodologies can be found here (TG) and here (HDL-C).

Important digression for context
What becomes critical to understand for our subsequent discussions is that the apoB particles have the potential to deliver cholesterol into an artery wall (the problem we’re trying to avoid), and 90-95% of the apoB particles are LDL particles. Hence, it is LDL particle number (LDL-P or apoB) that drives the particles into the artery wall. Thus, physicians need to be able to quantify the number of LDL particles present in a given individual. For decades there was no way of doing that. Then LDL-C (read on) became available and it served as a way (not entirely accurate, but nonetheless a way) of quantitating LDL particles.
Back to the story
How can one figure out the concentration of cholesterol in the LDL particle? As you may recall from last week, LDL is the “ship” that carries the most cholesterol cargo. More importantly, as I mentioned above, it is also the key ship that traffics cholesterol directly into the artery wall. Thus, there has always been an enormous interest in knowing how much cholesterol is trafficked within LDL particles.

For a long time it was not possible to directly measure LDL-C, the cholesterol content of an LDL particle. However, we did know the following had to be true:

TC = LDL-C + HDL-C + VLDL-C + IDL-C + chylomicron-C + remnant-C + Lp(a)-C
where X-C denotes the cholesterol content of a respective cholesterol-carrying particle. There are 2 particles in the equation above that I didn’t specifically mention last week, the remnant particle and the Lp(a) particle (pronounced “EL – pee – little – a,” which sounds less silly than, “Lip-a”). Lp(a) is an LDL-like particle but with a special apoprotein attached to it, aptly called apoprotein(a), which is actually “attached” to the apoB molecule of a standard LDL particle. Think of Lp(a) as a “special” kind of LDL particle. As we’ll learn later in this series, Lp(a) particles are bad dudes when it comes to atherosclerosis.

“Remnants” are nearly-empty-of-triglyceride particles of chylomicrons and VLDL. In essence they are larger TG-rich particles that have lost a lot of their TG core content as well as surface phospholipids and are thus smaller than, or remnants of, their “parent particles.” Hence,they are cholesterol-rich particles. Under fasting conditions, in a not-too-terribly-insulin-resistant person, IDL-C, chylomicron-C, and remnant-C are negligible. Furthermore, in most people Lp(a)-C does not exist or is not very high.

So we’re left with this simplification:
TC ~ LDL-C + HDL-C + VLDL-C
which is clearly an improvement in convenience over the first equation. But what to do about that pesky VLDL-C?

There are a number of variations, but essentially a breakthrough (mid 1970s) formula, called the Friedewald Formula, estimates VLDL-C as one-fifth the concentration of serum triglycerides (some variants use 0.16 instead of one-fifth, or 0.20). This assumes all TG are trafficked in one’s VLDL particles and that a normally composed VLDL contains five times more TG than cholesterol.
Rearranging the above simplified formula we have:
LDL-C ~ TC – HDL-C – TG/5
Let’s plug in the numbers from the above figure, as an example. TC = 234 mg/dL; HDL-C = 48 mg/dL, and TG = 117 mg/dL. Hence, LDL-C is approximately 234 – 48 – 117/5 = 163 mg/dL.
Kind of a long run for a short slide, huh? Perhaps, but it is important to understand that when you go to your doctor and get a “cholesterol test,” odds are this is exactly what you’re getting.
Therefore LDL-C can be estimated knowing just TC, HDL-C, and TG, assuming LDL-C matters (hint: it doesn’t matter much in many folks).

Furthermore, what if the LDL particle is cholesterol-depleted instead of its normal state of being cholesterol-enriched? Unfortunately, especially in an insulin resistant population (i.e., the United States), both TG content within lipoproteins and the exchange of TG for cholesterol esters between particles is very common, and using this formula can significantly underestimate LDL-C. Worse yet, LDL-C becomes less meaningful in predicting risk, as I will address next week.

What about direct measurement of LDL-C?

To chronicle the entire history of direct LDL-C measurement is beyond the scope of this post. Many companies have developed proprietary techniques to measure LDL-C directly, along with apoB, and ultimately LDL-P. I’ll address two “major players” here: Atherotech and LipoScience.

Atherotech developed an assay, called a VAP panel (VAP stands for Vertical Auto Profile) to do everything described above, but also to directly measure the amount of cholesterol contained within the LDL particle. Furthermore, they have developed assays to directly measure the cholesterol in IDL particles, VLDL particles, and even Lp(a) particles. Below is a snapshot of how VAP reporting looks.
VAP results
A couple of things are worth mentioning:
  1. Subparticle cholesterol content information is also generated, including 2 different classes of HDL particles (HDL-2, HDL-3) and 4 different classes of LDL particles (LDL-1, LDL-2, LDL-3, LDL-4).
  2. LDL particles, based on the subparticle information, are classified as “pattern A,” “pattern B,” or “pattern A/B.” Pattern A implies more large, buoyant LDL particles, while pattern B implies more small, dense LDL particles.
Remember, though, while cholesterol mass concentration numbers may correlate with the number of particles, they often do not. They only convey the mass concentration of cholesterol molecules within all of the particle subtypes per unit of volume. VAP tests do not report the number of LDL or HDL particles, but they do attempt to estimate atherogenic particle number (apoB) using a proprietary formula based on subparticle cholesterol concentration and particle sizes. I should point out that the formula, to my knowledge, has not been validated in any study and not published in a peer reviewed journal.

A high estimate of apoB100 (i.e., what the VAP reports) is said to correlate with the actual measurement of apoB. Since apoB is found on each LDL particle, this serves as a proxy of LDL-P. The American Diabetic Associate and the American College of Cardiology Consensus Statement on Lipoproteins and the new National Lipid Association biomarker paper stipulates that apoB must be done using a protein immunoassay, not an estimate, such as that of VAP.

But how can one actually count the number of LDL particles and HDL particles?

There are several methods of doing this, but only one company, LipoScience, has the FDA approved technology to do so using nuclear magnetic resonance spectroscopy, or NMR for short. The other available methodologies are ion mobility transfer and ultracentrifugation (by Quest) and separation of LDL particles with particle staining (by Spectracell). Virtually all guidelines (e.g., ADA, ACC, AACC and NLA) only advise LDL-P via NMR at this time.

NMR, which is the basis for not only how to count lipoprotein particles, but also diagnostic tests such as MRI scans, is really one of my favorite technical topics. In residency I wrote a surgical handbook and on page145-146, if you’re interested, you can read a brief description of how MRI technology works, which will explain how NMR technology can actually count lipoprotein particles.
As an aside, and just to give you an idea of what a great sport my wife is, I wrote this surgical handbook over the course of a year while in residency. To do so, I had to read approximately 8,000 pages of surgical textbooks and try to distill them down to just this 160 page summary. Doing so required reading about 22 pages every day while working about 110 hours per week, typical of a surgical residency “back in the day.” Besides exercising, I spent every single moment of my “free” time reading for and writing this handbook. Finally, a few months into it, my wife asked, “Why the hell are you doing this? You never watch TV, you never go out, you never do anything else!” I responded that it was the best way I could learn this material, but also, that I wanted to have a legacy when I left residency. Half joking, I asked her, “What’s your legacy?” Blank stare. A few months later, for Valentine’s Day, she gave me this t-shirt. I think it’s safe to say not a single person has read this handbook. So much for my legacy…
What's your legacy
A brief explanation of how NMR works to count (and measure) particles can also be found here.
Below is a snapshot of how NMR reporting looks. This particular report is from Health Diagnostics Laboratory (HDL), Inc. LipoScience performs the actual NMR test, but HDL, Inc. runs a number of complimentary biomarkers I will discuss in subsequent posts. I now use the HDL, Inc. test exclusively for reasons I will explain later.
NMR data
In addition to counting the actual total number of LDL particles (LDL-P) and HDL particles (HDL-P) per liter, HDL, Inc. (not LipoScience) directly measures apoB and apoA-I. Furthermore, the size of each particle is measured using NMR in nanometers (to give you a sense of how small these things are, and why we need to use nanometers to measure them, about 1.3 million LDL particles stacked side-by-side would measure only one inch).

The final point I’ll make about the value of NMR reported subparticle sizes and diameters is particularly telling when it comes to insulin resistance. In the panel below, you can see that this person has small VLDL particles, small HDL particles, and LDL particles. Why is this interesting? The presence of increased large VLDL-P, large VLDL size, increased small LDL- P, small LDL size, reduced large HDL-P, small HDL size are early markers for insulin resistance, and such findings may actually precede more conventional signs of insulin resistance (insulin levels, glycemic abnormalities) by several years. In other words, the number and size of the lipoprotein particles is perhaps the earliest warning sign for insulin resistance.
LP-IR data

In summary

  1. The measurement of cholesterol has undergone a dramatic evolution over the past 70 years with technology at the heart of the advance.
  2. Currently, most people in the United States (and the world for that matter) undergo a “standard” lipid panel which only directly measures TC, TG, and HDL-C. LDL-C can be measured directly, but is most often estimated.
  3. More advanced cholesterol measuring tests do exist to directly measure LDL-C (though none are standardized), along with the cholesterol content of other lipoproteins (e.g., VLDL, IDL) or lipoprotein subparticles.
  4. The most frequently used and guideline recommended test that can count the number of particles is the NMR LipoProfile. In addition to counting the number of particles – the most important predictor of risk – NMR can also measure the size of each lipoprotein particle, which is valuable for predicting insulin resistance in drug naïve patients, before changes are noted in glucose or insulin levels.
I know some of you are getting antsy. I thank you for your patience, and I hope you appreciate that it was a necessary step to get through this somewhat technical material and nomenclature. Next week we’ll get to the “fun” stuff – what does all of this cholesterol have to do with heart disease?

In addition, we’ll get further into the importance of using LDL-P as the best predictor of risk. If anyone wants to read up on another very important topic, especially for understanding why LDL-P is more important to know than LDL-C, get familiar with the concepts of discordant and concordant variables. You’ll be hearing a lot about these.
================================================================
Read the complete article here.

Be sure to read his complete series on cholesterol.

Previously, in Part I and Part II of this series, we addressed 4 concepts:
#1What is cholesterol?
#2What is the relationship between the cholesterol we eat and the cholesterol in our body?
#3Is cholesterol bad?
#4 How does cholesterol move around our body?